Embed Anywhere
Introduction
Embed Anywhere is a light-weight embedding extension which allows for instant integration of Qlik Sense charts, KPIs, data within any web page and full control over them. The solution makes single-click embedding possible, offering flexibility over page layouts, chart settings, while dynamically adjusting layouts based on the injected data.
With Embed Anywhere, Qlik teams do not need technical expertise or manual coding efforts to embed Qlik content externally. All it takes is a few minutes to turn a static or existing page with empty grids or layouts into a Qlik-powered page using an installable snippet or embed tool kit.
This guide covers installation of Embed Anywhere, its features, use cases and all controllable properties.
Prerequisites
1. Software & Dependencies
- Embed Anywhere Package: Ensure the latest Embed Anywhere package is available from SenseOps.
2. SenseOps Account
- You'll need a SenseOps account to download the Embed Anywhere. If you don't have a SenseOps account then visit SenseOps.com and click My Account. Create your SenseOps account.
3. Qlik Connectivity
-
Ensure you have the Qlik Enterprise installed in your system.
-
Ensure you have appropriate permissions in Qlik Management Console (QMC) to perform actions through Qlik Enterprise.
Note
Embed Anywhere is only accessable for Qlik Enterprise. It will not support Qlik Saas.
Installation
Follow the below steps as shown in video to easily install and access Embed Anywhere.
Step 1: Open your SenseOps account → select Custom Integrations → navigate to Embed Anywhere → click "Download without samples" to download the SenseOpsEmbedAnywhere(version).zip folder.
Step 2: Open Qlik Management Console (QMC). Go to Extensions under "MANAGE RESOURCES". Click Import and upload the extension ZIP file.
Step 3: Add the zip file and click "Import". Wait for the import process to finish. Verify that the extension is successfully imported without errors in the QMC.
Step 4: Open the dev-hub and select the Embed Anywhere.
- Click "View" on the bottom-right of the page to start working with Embed Anywhere.
Quick video
The short video covers setup and use of Embed Anywhere to embed Qlik charts and data within an existing web page.

Features
Embedding Qlik objects within the web page
- Click on the Page Inspect icon on the right side of the screen, point to any empty grid to add or click on existing content to replace with Qlik data.
- After selecting the object, a Grid settings popup will open with three sections.
- Select the application in the data selection dropdown, then choose the object from the Select Chart dropdown.
- Customize the chart by expanding the Chart styles section, where you can change the chart background color and padding. If no customization is made, the default styles from Global Settings will apply.
- In the Chart settings section, you can adjust settings like Read-only, Export to Excel, Maximization, and Hide header options.
- Finally, click Save. The Qlik object will be embedded into your webpage with either your custom styles or the default Global Settings.
Editing Qlik objects within the web page
- Click on the View List icon on the right side of the screen. Select the Edit icon next to the object you wish to modify.
- The Grid settings popup will open, where you can make your desired changes.
- After making adjustments, click Update to apply changes to the embedded object.
Embedding KPIs within the web page
-
Click on the Page Inspect icon on the right side of the screen. Select the label object you want to replace.
-
In the Grid settings popup, choose the KPI section.
-
In the data selection section, select the application and choose a KPI from the available options (Measure, Variable, Expression).
-
Modify the number format if needed, and assign actions (e.g., Clear All Sections) under the KPI Actions section.
-
Click Save to embed the KPI into your webpage.
Adding Actions to Objects
- Click on the Page Inspect icon and select the object to which you want to add actions.
- In the Grid settings popup, go to the Actions tab.
- Select the application and click Add Action. Choose from the available actions, such as Apply Bookmark.
- After selecting your desired action, click Save to apply it to the object.
Deleting Embedding objects in the web page

- Click on the View List icon on the right side of the screen, then select the Delete icon next to the object you wish to remove.
- The object will be deleted from the webpage.
Advantages
-
Ease of Integration: Embed Qlik Sense objects into any webpage with a simple and intuitive interface.
-
Customization: Tailor the appearance of embedded charts, KPIs, and reports to match the design and branding of your website.
-
Real-Time Data: Always present the latest data by embedding dynamic objects that update automatically.
-
User Interactivity: Enable users to interact with the data, drill down, and explore insights without leaving the webpage.
-
Scalability: Whether for internal websites, applications or 3rd party apps (ex: Salesforce, SharePoint, ERPs...), Embed Anywhere is flexible for all use cases.
Properties
Grid settings
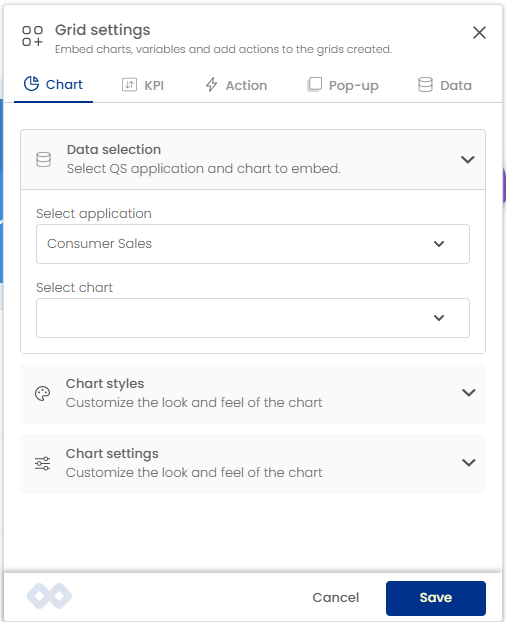
Once you select a location for embedding a Qlik object, the Grid Settings popup will appear. In this popup, there are several sections to configure:
Chart
In the Chart tab, you will find the following sections:
1. Data Selection: To embed objects from your Qlik Sense applications by selecting the desired application from the Select Application dropdown in the Data Selection section.
- Once the application has been selected, users can browse through all available objects from the Chart Selection dropdown list and select the one they wish to embed with ease.
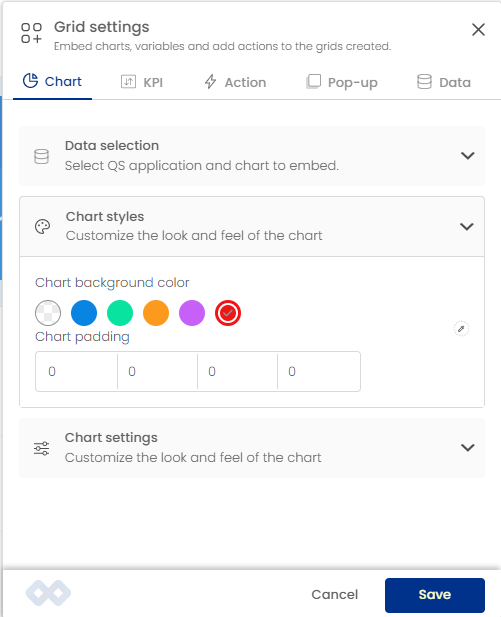
2. Chart Styles: To customize the appearance of a chart, users can utilize the Chart Styles section. This feature includes options for changing the chart's background color and adjusting the chart padding.
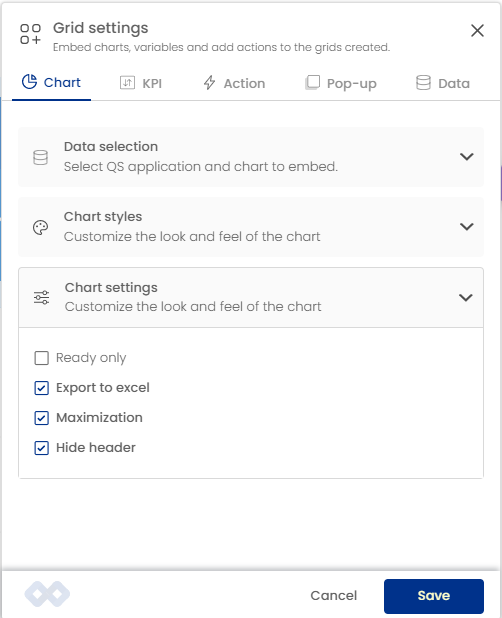
3. Chart Settings: To modify the properties of a chart, users can access the Chart Settings feature. This section provides users with the ability to easily enable and disable various properties like Read-Only, Export to Excel, Maximization, and Hide header of the chart to better meet their specific needs.
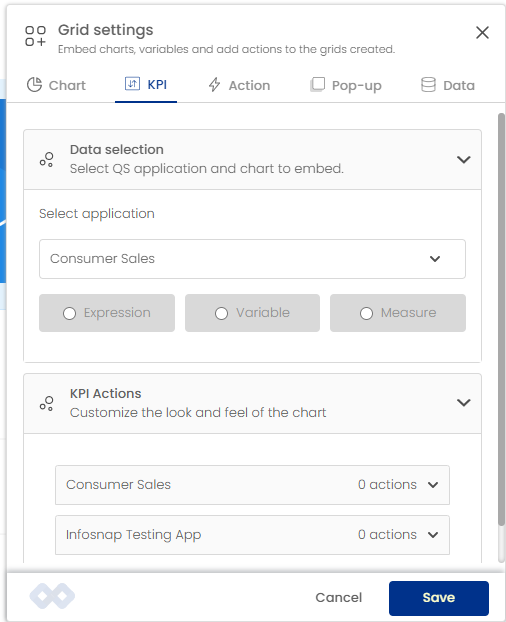
KPI
In the KPI tab again we have Data Selection, and KPI Actions sections as shown in the below figure.
-
Data Selection: To embed KPI objects from your Qlik Sense applications by selecting the desired application from the Select Application dropdown in the Data Selection section. After selecting an application, users can choose to add either an Expression, Variable, or Measure to their project, depending on their specific needs.
-
KPI Actions: To add KPI actions for KPI objects, users can utilize the KPI Actions section. This feature provides an easy way to assign actions to KPI objects, allowing users to quickly and efficiently interact with data and gain valuable insights.
Action
- Action feature allows users to easily add various actions while doing the mouse click such as Clear All Selections and Apply Bookmarks etc, to their project, providing users with enhanced interactivity and greater control over their data.

Info
Media and Data will be coming soon
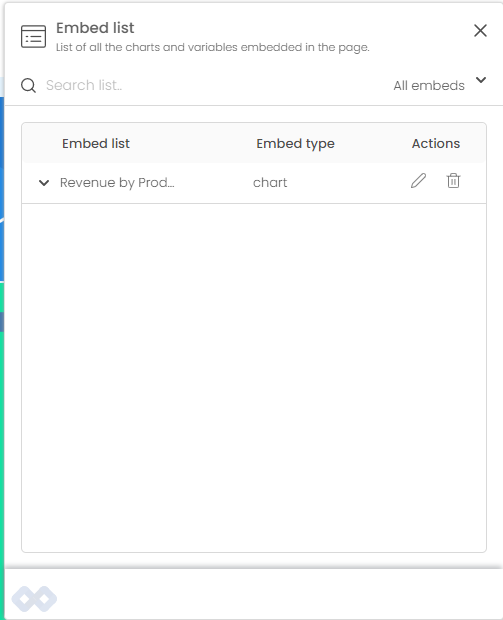
Embed list
- The Embed List screen displays all the embedded objects on the webpage. From this list, you can easily edit or delete any objects as needed.
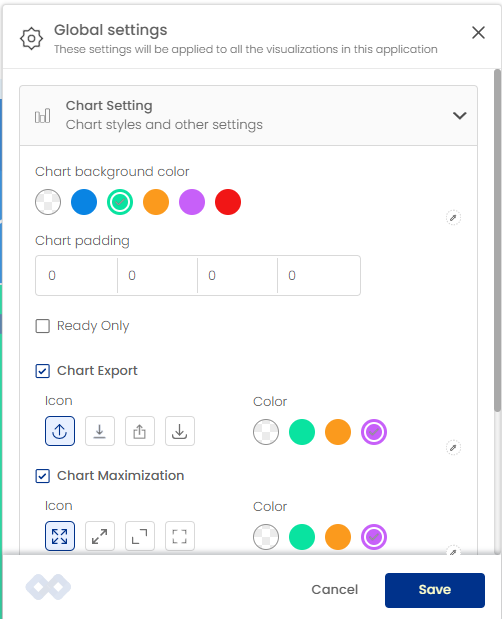
Global settings
-
The Global Settings allow you to apply universal settings across all embedded objects. It consists of three main sections: Chart Setting, Loader Setting, Qlik sense theme
-
Chart Setting feature is mainly focused on the appearance of the object, allowing users to customize settings such as background color, chart padding, read-only mode, chart export, maximization, and header visibility. These settings provide users with complete control over the look and feel of their embedded objects, ensuring a professional and visually appealing presentation.
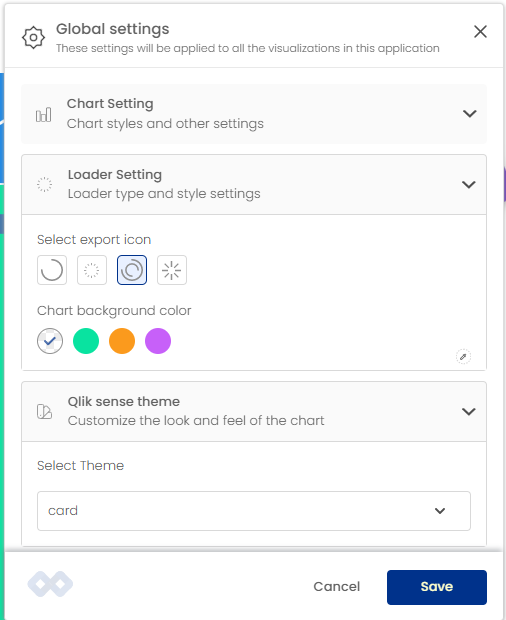
-
Loader Setting feature is primarily focused on the appearance of the object loading symbol and chart background colors. With this feature, users can customize loading indicators, providing users with visual feedback on the status of embedded objects.
-
Qlik sense theme dropdown allows users to set themes for Qlik Sense objects that are embedded in their webpage.
Adding Embed-Anywhere to Websites
- After completing the setup, navigate to the Integrations page and select an application.
- Click the three dots associated with the application to reveal actions such as Code Snippet, Launch, Export, and Delete.
- Select Code Snippet, as shown in the image below.

- A pop-up window will display the code snippet. Copy this code and paste it into the
<header>tag of your website.

- Once Embed Anywhere is embedded into your website, you will see three icons: Selector, Embed list, and Global settings on the right side of your website screen.

Embed Anywhere simplifies the integration of Qlik Sense analytics into web pages, offering businesses flexibility in presenting data-driven insights and enhancing user experiences.