
Redefine dashboarding experience in Qlik Sense with advanced and flexible extensions for your Tables. Include media formats, charts and values within cells or columns and enrich your data. Improve analysis by adding new fields, powerful HTML tool-tips and conditional representation of data.
Download sample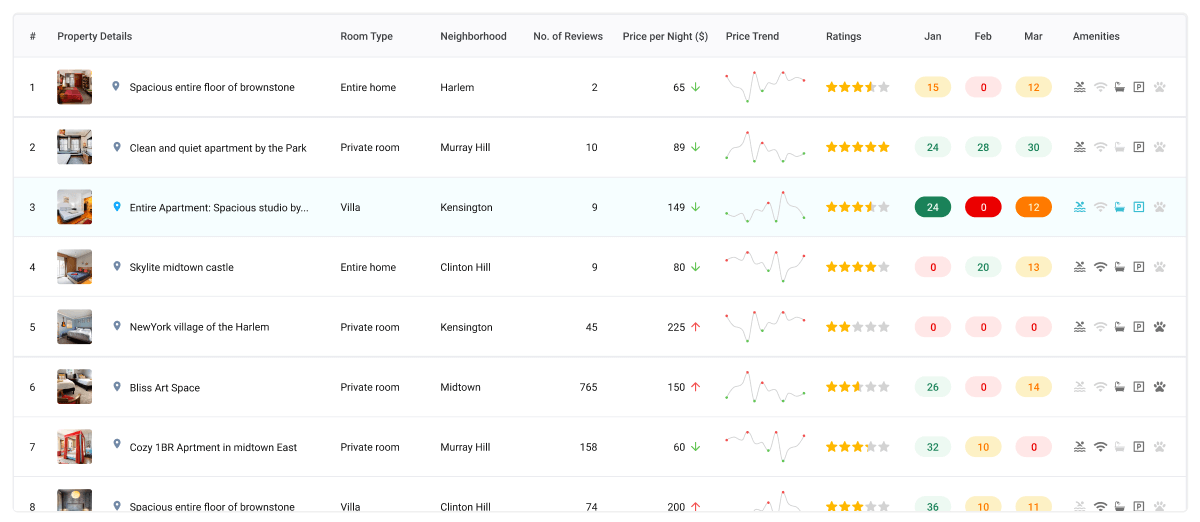

Unlock what’s possible within a cell. Represent data using a variety of chart options line, combo, bar, sparklines or more. Combine spreadsheet-like power with useful highlights and formatting that best works for your data.

Depict ratings, reviews and scorecards as simple icons or use them with combination of numbers and progress bars. Overlook native constraints in Qlik and visualise insights in curated views either within a cell or as tool-tips.

Change the visual grammar of how media is controlled within a cell. Make a showcase of icons and show, hide or disable individual elements based on conditions. Control spacing, size, formatting and use of external links to generate on-the-fly.

A tool-tip that’s not a usual one. An extension that lets you bring out a layout as good as a web page. Showcase catalogues or the story behind your charts in a single canvas and Include rows of formatted content and icons within.
This feature can be viewed
only on a desktop
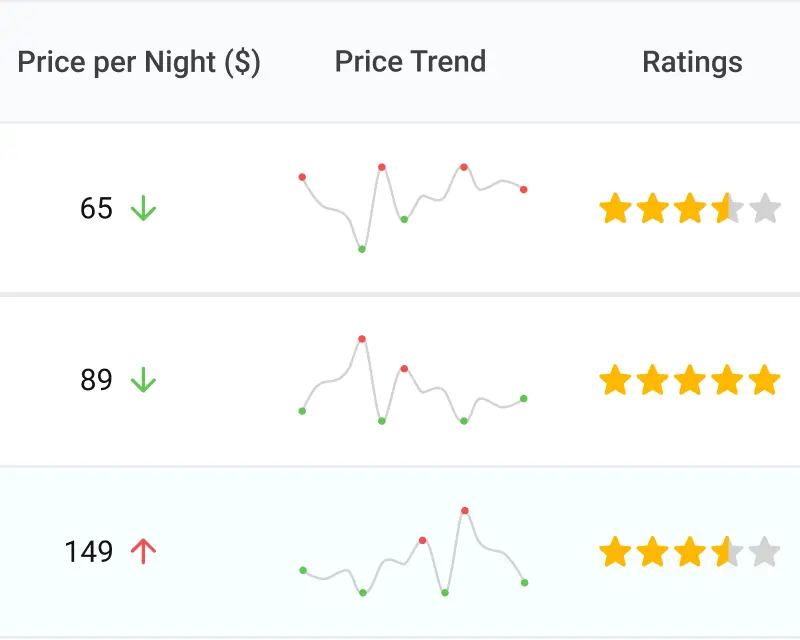
Visually enrich the data within cells using with mini-charts, sparkline trends or highlighters. Explore new perspectives by combining data types, values with visual elements and custom colors.
Access Documentation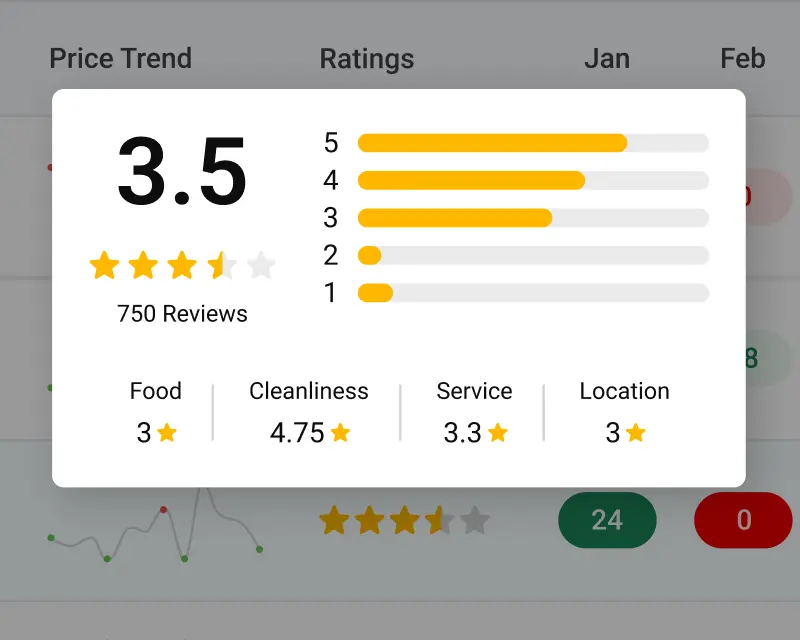
Get interactive tool-tips to convey the story behind your data. Give your users the experience of a web page with modern design elements, visuals and a fresh context on your data without interrupting their analysis.
Access Documentation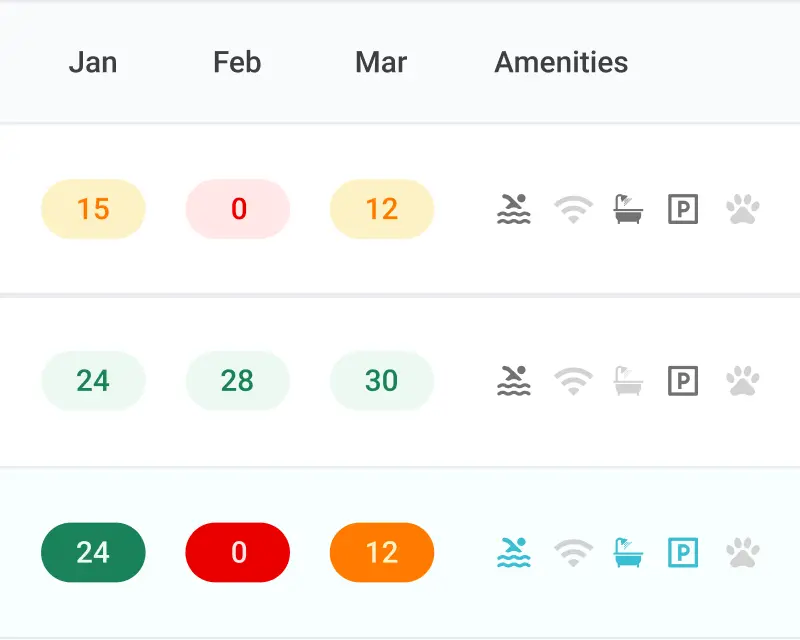
Break the monotony of native Qlik experience with rich media elements and formatting options. Use icons, images or their links within cells and apply custom styling on data based on conditions.
Access Documentation

Exponential gains from Qlik Investments
All of Qlik's journey under one-roof
Accelerated adoption across teams
Fresh insights, powered by automation
© 2026 SenseOps Copyrights Reserved