
Plan, track, and visualize project timelines with clarity and precision. Compare tasks, monitor progress, and manage dependencies in a single interactive view. Customize task bars, timelines, and interactions to gain deeper insight and control over your projects.
Download now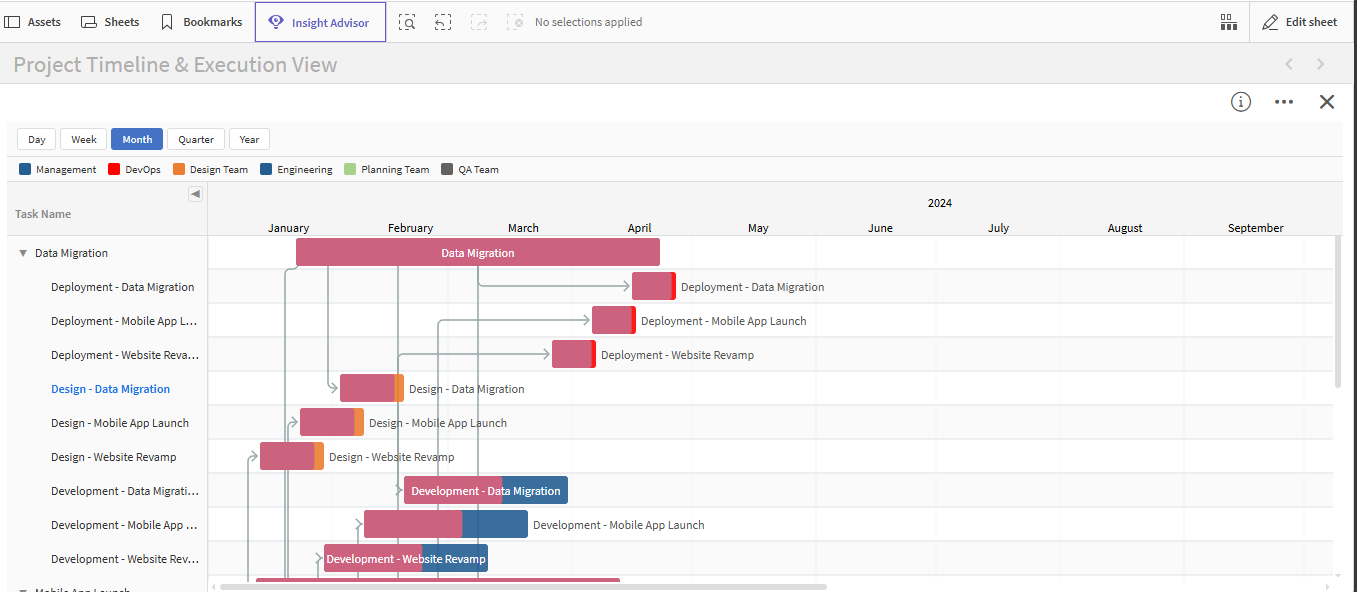
View tasks, durations, and dependencies together in a single timeline. From simple schedules to complex hierarchies, get a clear picture of your entire project.
Access Documentation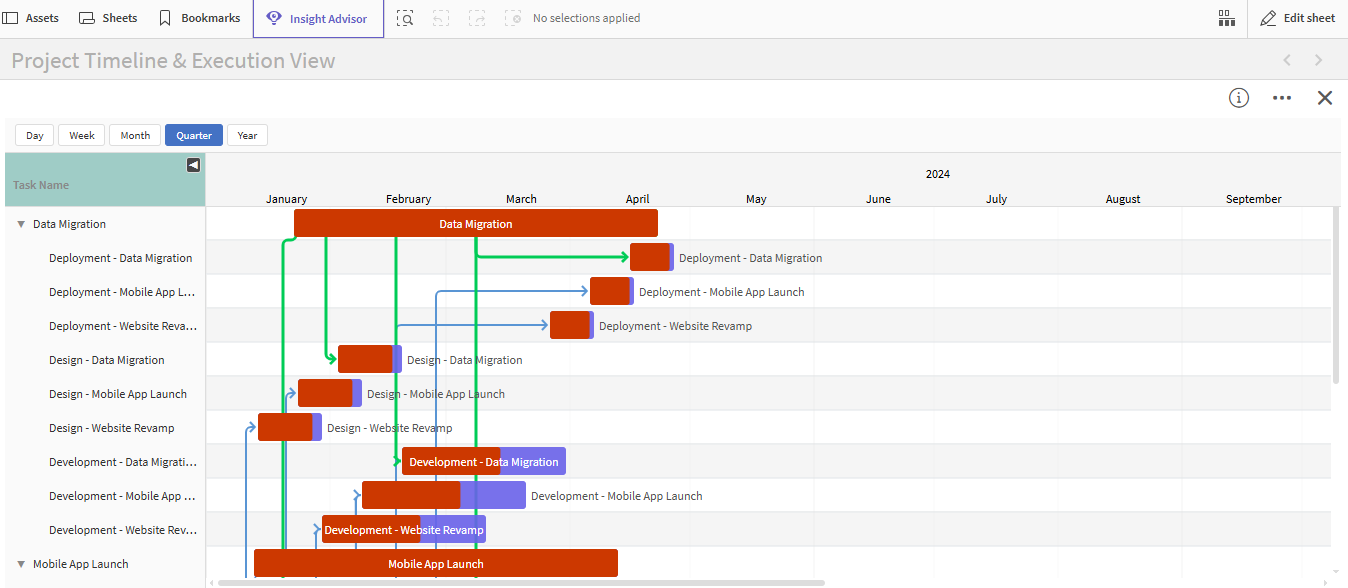
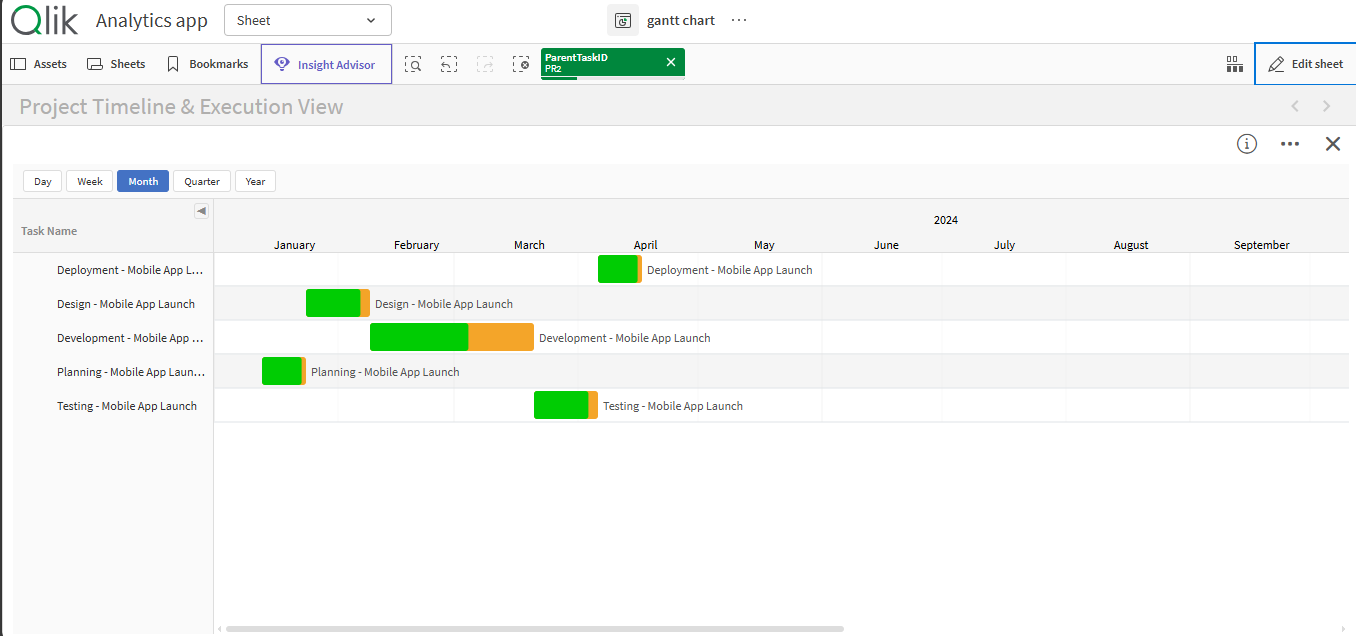
Define task relationships, highlight critical paths, and monitor progress as work moves forward. Quickly understand what’s impacting your timeline.
Access Documentation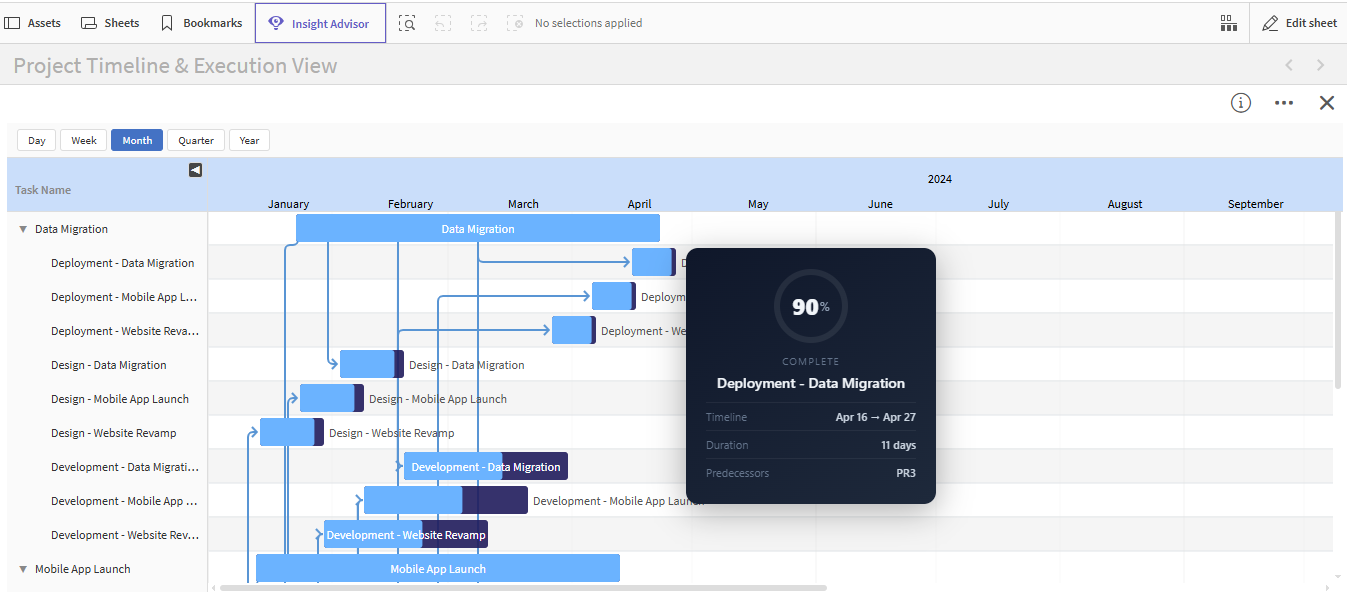
Adjust how your chart looks and behaves with customizable views, tooltips, and interactions. Explore your data with ease through zoom and on chart actions.
Access Documentation
Exponential gains from Qlik Investments
All of Qlik's journey under one-roof
Accelerated adoption across teams
Fresh insights, powered by automation
© 2026 SenseOps Copyrights Reserved